What’s Been Happening?
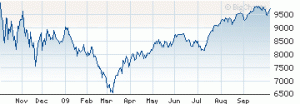
The US stock market as represented by the Dow Jones Industrial Average has recovered from a low of roughly 6,500 in March to a third quarter close of approximately 9,700, a 49% gain not including dividends. We agree with those who call this a “relief rally”. Most investors are relieved that the financial system survived what felt like a severe heart attack.
DJ Industrial Average over the last year

Source: Wall Street Journal Market Data Group
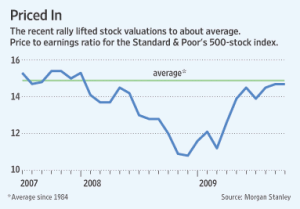
In retrospect, the impressive recovery to date should not have been surprising given the severity of the decline and the resulting relative cheap stock prices. Now it appears that the market is more fairly valued [see chart below] so continued gains will have to rely more on improvements in company earnings. As corporate cost cutting measures run their course, sales growth driven by a rebounding economy will be needed to propel stocks further.

Much of the cost savings have come at the expense of jobs. With unemployment hovering just below 10%, it is approaching the high reached during the recessionary period in 1982. The most recent consumer confidence reading by Reuters/University of Michigan showed improvement in August but still sits close to the lows reached over the last five recessions. Accounting for about 70% of economic activity, the American consumer needs to re-engage for the recovery to endure. Much of the recent gains can be tied to recently concluded government incentives such as the “Cash for Clunkers” program. According to a recent Federal Reserve survey, the US recession may be over, with economic activity stabilizing or improving over most of the nation. Time will tell if the stimulus effort helps kick-start the economy or results in a false start.
Fortunately, many of the economies we invest in across the globe appear to be stabilizing and recovering – some due to government stimulus and others more organically.
Trends to be Aware of
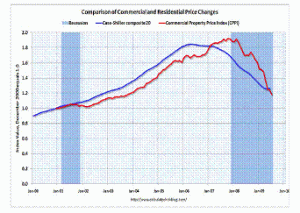
The main cause of the stock market meltdown can be traced to the collapse of the real estate bubble [below left]. While housing sales and prices [blue line] appear to be showing signs of leveling off from their significant declines, it remains unclear if real estate has hit a bottom. The red line shows commercial real estate price changes. Commercial real estate peaked later than residential and has fallen more sharply since its peak. Given the lack of sales activity and delay in write downs by banks, it could take another couple of years for this sector to normalize. Having said that, real estate investment trusts [REITs] have been one of the shining stars during the 3rd quarter – up 32.9% according to Dow Jones.
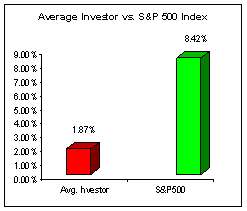
The strategy of sticking to a long term asset allocation including stock funds has been called into question during the recent market decline. However, a study published in March 2009 by research firm, DALBAR, confirms Fear and Greed are difficult emotions to navigate. It found during the 20 years from 1989 through 2008 that the average stock fund investor experienced returns of only 1.87% per year while the S&P 500 index returned 8.42% [above right]. The significant outperformance by the index shows that investors are better off ignoring emotions and maintaining a disciplined approach.
Some Numbers for Comparison:
The following table compares some key indices against which fund performance is measured. All figures are for the periods ending 09/30/2009.
|
Index |
What it Measures |
Last 3 Mos. |
Last 12 Months |
3 Years Annlzd |
5 Years Annlzd |
10 Years Annlzd |
| Standard & Poors 500 | U S Stocks w/div |
15.61% |
-6.91% |
-5.43% |
1.01% |
-0.16% |
| Russell 2000 | Small Stocks |
19.28% |
-9.55% |
-4.57% |
2.41% |
4.88% |
| MSCI EAFE | Foreign Stocks |
19.47% |
3.23% |
-3.60% |
6.07% |
2.54% |
| MSCI Emerging Mkts | Emerging Mkts |
20.91% |
19.07% |
7.95% |
17.31% |
11.38% |
| MSCI World Stock | Global Stocks |
17.57% |
-1.64% |
-3.80% |
4.07% |
1.40% |
| DJ Real Estate Tot Ret | Real Estate |
32.86% |
-26.18% |
-13.47% |
0.17% |
8.97% |
| Barclays 1-5 yr Gov/Cr | Bonds |
2.13% |
7.92% |
5.87% |
5.87% |
4.92% |
| CPI * | Inflation |
0.07% |
-1.35% |
2.08% |
2.59% |
2.54% |
Chart Data Source: Thomson Financial
* CPI information is not current for past month.


