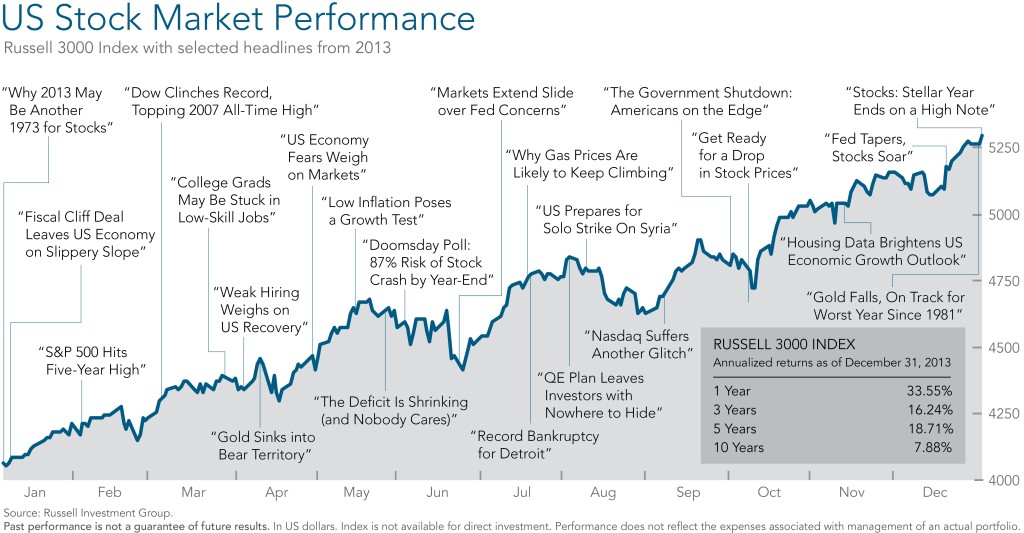
The unusually strong performance of US stocks in 2013 was a welcome surprise for investors who are following a simple buy-and-hold strategy and a source of exasperation for many professionals caught flatfooted by the steady rise in share prices. The S&P 500 rose more than 32% in 2013, its best year since 1997. The broader Russell 3000 index (which includes both large and small company stocks) did even better, gaining 33.55% in 2013.
This chart also reminds us there was a steady chorus of worrying media headlines throughout the year. We entered the final three months of 2013 with the US Government closed and our economy threatened by a mandatory sequester. But as we pointed out at the time [and many times in the past], it is hard to know how markets will react to the news, and acting on a wrong prediction can be very costly.
The media got it wrong (e.g. October 2013 “Get Ready for a Drop in Stock Prices”, Shefali Anand, Wall Street Journal) but did the Wall Street experts continue to get it right?
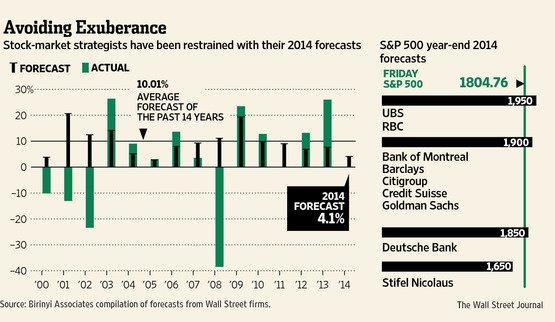
Source: Wall Street Journal 11/23/2011. Actual results represent the S&P 500 index.
The black “Ts” in the chart above show the average market forecast from Wall Street firms at the outset of the year and the green bars indicate the actual results. From a quick review of the chart there are only three years out of the last 15 in which the so-called experts’ predictions were even close to the actual results. Three out of 15 is a 20% record, leaving an 80% miss rate.
Unfortunately, we can’t rely on the highly paid “market strategists” from the major brokerage firms and banks to predict market results either.
Notice the strategists as a group have never predicted a loss which makes their misses in 2001, 2002 and 2008 even more noteworthy. In 2008, the Wall Street consensus was off by 50 percentage points!
We look forward to discussing your investments or touching base on other topics that affect your financial well being. Just try to resist the temptation to ask us for forecasts!


