“I increasingly think Europe and the impending fiscal cliff are likely to lead to a new recession and a further decline in the market.” –Comment from an MFA client-
Some wonder if a “buy-and-hold” philosophy is appropriate given all the predictions that stocks are going to decline sometime this year due to bloated government debt in Europe [and the US], the fiscal cliff [expiration of the Bush-era income tax cuts] and every other issue that causes economic concern. With the continual repositioning of stocks within the funds we buy on your behalf, as well as our monitoring and rebalancing, we would not say we follow a traditional “buy-and-hold” or “buy-and-hope” strategy.
If we knew with certainty that global stock markets were going to swoon this year, we would sell stock exposure in our client accounts to avoid it. Even if our prediction happened to be correct, our timing would have to be great too. If the market climbs and we miss it, we would not be helping you to grow your wealth. Timing your re-entry into the markets is devilishly difficult – as you can ask anyone who has been sitting on cash for the last three years while the S&P 500 index has appreciated 62% and the Barclays Capital US Government/Credit 1-5 Year index grew by 11% cumulatively.
We recall the most recent “best day” to enter stocks on March 9, 2009. We remember vividly how difficult it was to pull the trigger just on the modest rebalancing we were doing at the time. You may recall the media and many market pundits warned there was still much more to fall and the financial system was in grave danger of failing completely.
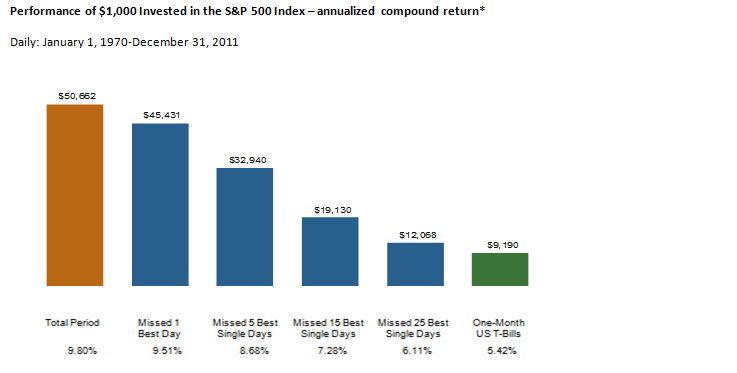
The chart below shows the cost of missing a relatively small number of the most productive market days over a 40-year time frame. With approximately 200 days during the year when the investment markets are open, the total days over the 40-year period equal roughly 8,000.
Performance of $1,000 Invested in the S&P 500 Index – annualized compound return*
Daily: January 1, 1970-December 31, 2011
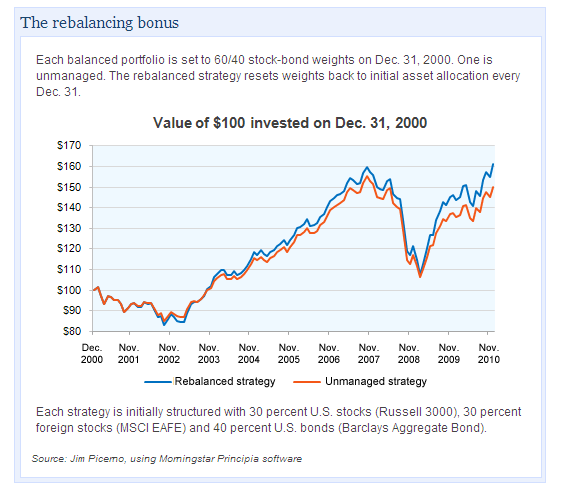
Despite the worrisome environment of today, we still find that maintaining an appropriate mix of growth and income assets combined with disciplined rebalancing is the right course. A recent study by Fidelity Investments concurred showing that over the ten year period ended 12/31/10 simple rebalancing was responsible for a 60% stock/40% bond portfolio to return 4.9% per year compared to 4.1% per year without rebalancing.
Please let us know if you would like to discuss these concepts further or review your investment allocation.
*Performance data for January 1970-August 2008 provided by CRSP; performance data for September 2008-December 2011 provided by Bloomberg.
The S&P data are provided by Standard & Poor’s Index Services Group. US bonds and bills data © Stocks, Bonds, Bills, and Inflation Yearbook™, Ibbotson Associates, Chicago (annually updated work by Roger G. Ibbotson and Rex A. Sinquefield).
Indexes are not available for direct investment. Their performance does not reflect the expenses associated with the management of an actual portfolio. Dimensional Fund Advisors is an investment advisor registered with the Securities and Exchange Commission. Information contained herein is compiled from sources believed to be reliable and current, but accuracy should be placed in the context of underlying assumptions. This publication is distributed for educational purposes and should not be considered investment advice or an offer of any security for sale. Past performance is not a guarantee of future results. Unauthorized copying, reproducing, duplicating, or transmitting of this material is prohibited.
Date of first use: June 1, 2006.


