What’s Been Happening?
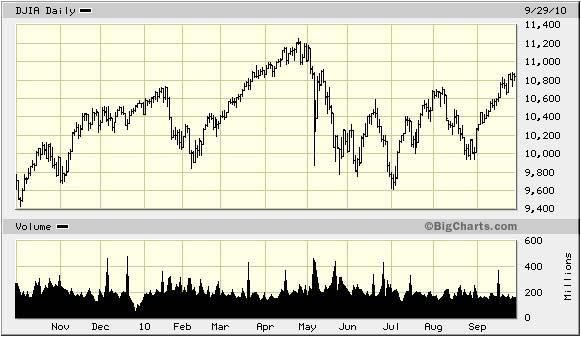
US stocks have been trading within a fairly wide range over the last year. Peaks and troughs were created by hope that the economy was finally recovering to fear that a double dip recession was imminent. Despite the volatility, US stocks were up about 10% over the last twelve months while international emerging market stocks appreciated about 20%. Stocks in international developed markets suffered declines earlier in the year due to sovereign debt concerns [Portugal, Ireland and Greece] holding back their annual results to around 3%.
Dow Jones Industrial Average – September 30, 2009 to September 30, 2010
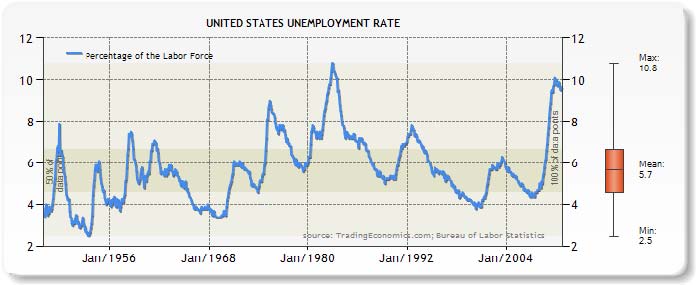
According to the most recent government report, unemployment continues to be stuck at 9.6%. Small gains in the private sector were offset by government sector headcount reductions. Below is a historical look at the unemployment rate. It appears that we will not see a sharp peak and quick decline in unemployment as with many past recessions. The current environment is starting to leave more of a flat top similar to the period following the recessions in 1974 and 2001 [see arrows below].
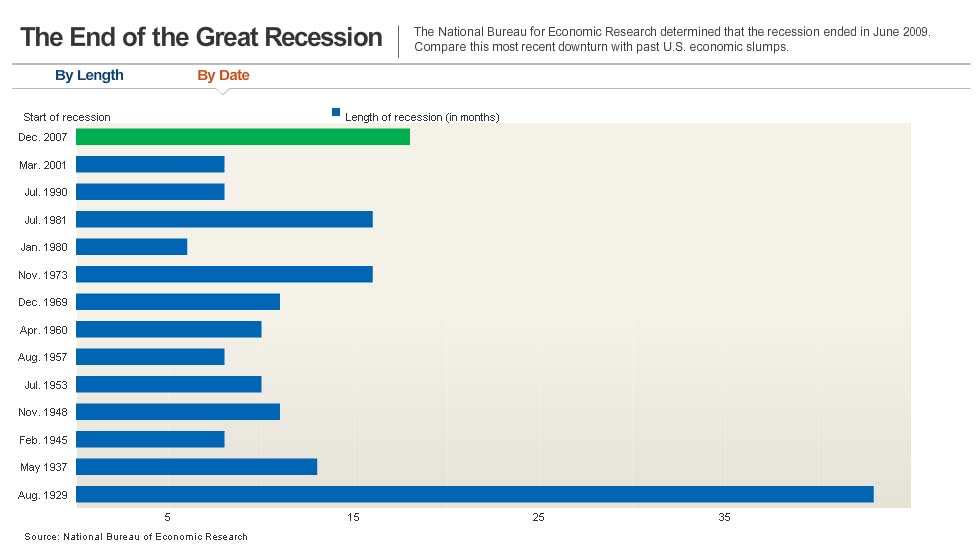
While most Americans haven’t felt it, the recession has officially ended and it’s no surprise that the length [green bar below] was longer than average. We expect that the recovery will be longer than average as well.
Other Trends To Be Aware Of
International emerging market stocks remained largely unaffectedby the financial crisis. This is apparent from their circa 13% annualized returns in the 5 and 10 year periods below. We continue to hold our normal allocation to this asset class and resist suggestions to increase exposure to the relatively volatile sector based on past performance.
In the last quarter and year, we have seen a return to a more normal relationship between bond and stock returnswhere stocks typically outperform bonds. The continued heavy flow of money into bond mutual funds and the current low interest rate environment give us reason to be concerned about bond performance going forward. While we will continue to maintain short and intermediate bond holdings to reduce risk in our client accounts, we are concerned that investors reaching for yield in longer term and riskier bonds may be set up for disappointing results.
Tax rateson dividend income and capital gains for 2011 and beyond remain unknown as Congress postponed action until after the mid-term elections. We will continue to monitor this space closely and adjust accounts accordingly.
Some Numbers for Comparison: The following table compares some key indices against which fund performance is measured. All figures are for the periods ending 9/30/2010.
|
Index |
What it Measures |
Last 3 Mos. |
Last 12 Months |
3 Years Annlzd |
5 Years Annlzd |
10 Years Annlzd |
| Standard & Poor’s 500 | U S Stocks w/div |
11.30 |
10.17 |
-7.16 |
0.64 |
-0.43 |
| Russell 2000 | US Small Stocks |
11.29 |
13.35 |
-4.29 |
1.60 |
4.00 |
| MSCI EAFE | Int’l Devlpd Mkts |
16.48 |
3.27 |
-9.51 |
1.97 |
2.55 |
| MSCI Emerging Mkts | Int’l Emerg Mkts |
18.16 |
20.54 |
-1.20 |
13.08 |
13.77 |
| DJ World Stock Index | Global Stocks |
14.54 |
9.55 |
-6.65 |
2.91 |
2.29 |
| DJ Real Estate Tot Ret | Real Estate |
13.30 |
29.24 |
-6.68 |
0.97 |
9.25 |
| Barclays 1-5 yr Gov/Cr | Bonds |
1.66 |
5.15 |
5.70 |
5.31 |
4.90 |
| CPI * | Inflation |
0.16 |
1.08 |
1.55 |
1.89 |
2.31 |
Chart Data Source: Thomson Financial * CPI information is not current for past month. Market indexes are included in this report only as context reflecting general market results during the period. Marin Financial accounts may trade in securities that are not represented by such market indexes and may have long concentrations in a number of securities and in asset classes not included in such indexes. Accordingly, no representations are made that the performance or volatility of the Marin Financial accounts will track or reflect any particular index. Market index performance calculations are gross of management fees.


