What’s Been Happening?
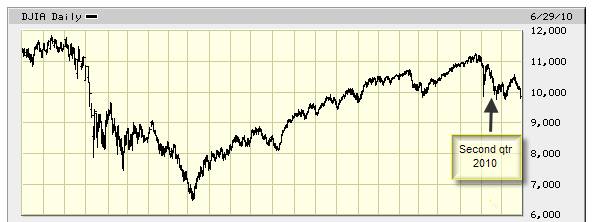
Stock markets around the world have dropped significantly during the quarter. The Dow Jones Industrial Average retraced from slightly over 11,000 to a bit below the psychologically important 10,000 level [down 10%]. Broader global indexes like the Dow Jones World Stock Index were off closer to 12%.
Dow Jones Industrial Average – June 30, 2008 to June 30, 2010

Source: Schwab & Co., Inc.
We Got Ahead of Ourselves
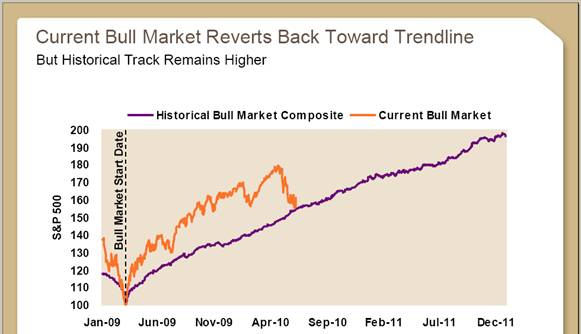
A 70% run up in the S&P 500 in 13 months from the Bull Market Start Date [March 9, 2009] was “too far, too fast” compared to previous recoveries. Interestingly, with this pullback, the index is back on the line that shows its average performance after bull markets begin. Unfortunately, we can’t assume from this “trendline regression” that stocks will halt their recent downturn but overleaf you will see that larger corrections are less common.

Stock Market Corrections are Scary
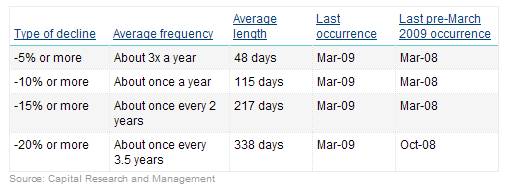
Given the market tumult of the last few years, investors have reason to be on edge and some are selling first and asking questions later. In fact, 10% stock market corrections are fairly common and happen on average about once a year. Therefore, we are concerned that some may mistake one of those with a 45% correction like the one we saw in 2008-2009 which occur much less frequently. While taking action might feel better emotionally, we don’t believe it is the foundation for an excellent investment discipline. Our job is to remove some of that emotion from investing decisions and to get clients to focus on the long term which is really what matters. Let us know if you would like to talk about this.
Other Trends To Be Aware Of
“Japan-style Muddling”?: In a recent interview with the NY Times, Jeremy Grantham, chief investment strategist at GMO, raised the possibility the US will muddle through another 10 years of low growth like the last 20 years in Japan. The counterpoint: the US government has acted much quicker to stimulate our economy but, we can’t ignore the potential malaise given the growing deficit and sluggish bank lending.
Thriftiness Is In: If you have been cutting expenses in response to difficult times, you are in good company. A recent Gallup Poll found that 62 percent of us would rather save money than spend it, up from 48 percent in 2001.
Mortgage Rates Are Low: According to HSH Associates “We presently have the lowest mortgage rates in some 54 yearsin the market, far better than what we (or anyone else, for that matter) expected.” We are available to help you determine if refinancing your home mortgage makes sense.
Unemployment Remains Stubbornly High: At 9.5%, the official unemployment rate is 56% higher than the average since 1980 of 6.2%. The annual rate during that 30 year period drifted within a range of 4% at the low end in 2000 to a 9.7% high in 1982. Coincidentally, 1982 was the beginning of the longest bull market in modern history and early 2000 [when unemployment was at its low] marked the end of that bull market.
Some Numbers for Comparison:
The following table compares some key indices against which fund performance is measured. All figures are for the periods ending 6/30/2010.
|
Index |
What it Measures |
Last 3 Mos. |
Last 12 Months |
3 Years Annlzd |
5 Years Annlzd |
10 Years Annlzd |
|
Standard & Poor’s 500 |
U S Stocks w/div |
-11.42 |
14.43 |
-9.81 |
-0.80 |
-1.59 |
|
Russell 2000 |
US Small Stocks |
-9.92 |
21.48 |
-8.60 |
0.37 |
3.00 |
|
MSCI EAFE |
Int’l Devlpd Mkts |
-13.97 |
5.92 |
-13.38 |
0.88 |
0.15 |
|
MSCI Emerging Mkts |
Int’l Emerg Mkts |
-8.29 |
23.48 |
-2.22 |
13.07 |
10.34 |
|
DJ World Stock Index |
Global Stocks |
-11.68 |
13.20 |
-10.01 |
1.66 |
0.56 |
|
DJ Real Estate Tot Ret |
Real Estate |
-4.36 |
51.56 |
-10.49 |
-1.12 |
9.03 |
|
Barclays 1-5 yr Gov/Cr |
Bonds |
1.78 |
5.64 |
6.03 |
4.93 |
4.97 |
|
CPI * |
Inflation |
-0.03 |
0.87 |
1.45 |
2.27 |
2.35 |
Chart Data Source: Thomson Financial * CPI information is not current for past month. Market indexes are included in this report only as context reflecting general market results during the period. Marin Financial accounts may trade in securities that are not represented by such market indexes and may have long concentrations in a number of securities and in asset classes not included in such indexes. Accordingly, no representations are made that the performance or volatility of the Marin Financial accounts will track or reflect any particular index. Market index performance calculations are gross of management fees.


