What’s Been Happening?
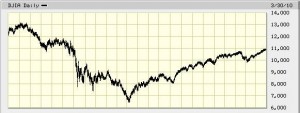
Stock markets around the world have continued one of the strongest rebounds on record since the lows that were established in March of 2009. Such a V-shaped recovery gives the impression that there might have been some overreaction on the downside. The chart below illustrates the recovery to date as the Dow Jones Industrial average climbed to 11,000 over the past year. While the index appreciated by an impressive 46.9% during the last twelve months, stocks in the USremain approximately 25% below their peak in October 2007.
Dow Jones Industrial Average – March 31, 2008 to March 31, 2010

Source: BigCharts.com
Is Inflation Coming?
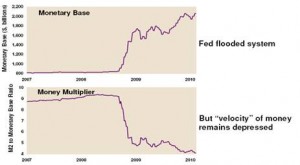
Probably not until the “Money Multiplier” starts to rise.This is the ratio of M2 (cash and the most liquid check writing and savings accounts) divided by the entire Monetary Base. There is a lot of money but it’s not flowing quickly enough to produce the demand that is part of rising prices. We have been adding Treasury Inflation Protected bond funds to our portfolios to position ourselves to cope with inflation when it arises.
Source: FactSet, Federal Reserve
Employment Showing Signs of Life?
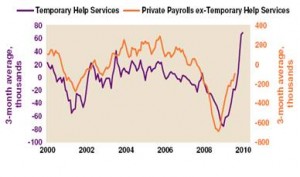
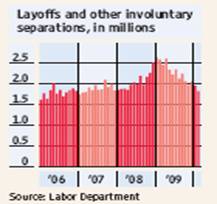
The official unemployment rate hovers at just below 10%. Hiring at Temp Firms is often a leading indicator to permanent hiring. Companies appear to have cut “into bone” with layoffs last year and the recent surge in temporary hiring may be a harbinger of more permanent jobs on the horizon. As of January 2010, Temporary Help Services had advanced five months in a row [see chart below left]. The chart below right shows that layoffs have peaked and are trending down to pre-recession levels. There is even some indication that the economy began creating jobs overall in March.
Source: FactSet, High Frequency Economics, USDept. of Labor
We’re NotOut of the Woods Just Yet, but There Are Positive Signs.
Of course many valid concerns remain on the road to recovery. Among these are a troubling global shift in debt from the private sector to the public sector; continuing commercial real estate losses; large budget deficits (federal, state and local); and political tensions.
On a more positive note, there are many bullish factors at play: the unprecedented global stimulus has started to act like a coiled spring for economies around the globe. There are some early signs that a USeconomic recovery has begun. Companies are beginning to replenish inventories, expand production and selectively hire. Housing appears to be bottoming; inflation remains tame while household savings/net worth is now rising. The gross domestic product of the US, which was shrinking at a rate of 6.4% in the first quarter of 2009, grew at a blistering pace of 5.6% in the fourth quarter. Recessions are always followed by recoveries; it is typically very difficult to appreciate them when they first appear.
Some Numbers for Comparison:
The following table compares some key indices against which fund performance is measured. All figures are for the periods ending 3/31/2010.
|
Index |
What it Measures |
Last 3 Mos. |
Last 12 Months |
3 Years Annlzd |
5 Years Annlzd |
10 Years Annlzd |
|
Standard & Poor’s 500 |
U S Stocks w/div |
5.39 |
49.77 |
-4.17 |
1.92 |
-0.66 |
|
Russell 2000 |
US Small Stocks |
8.85 |
62.77 |
-3.99 |
3.36 |
3.68 |
|
MSCI EAFE |
Int’l Devlpd Mkts |
0.87 |
54.44 |
-7.02 |
3.75 |
1.27 |
|
MSCI Emerging Mkts |
Int’l Emerg Mkts |
2.45 |
81.55 |
5.46 |
16.00 |
10.11 |
|
DJ World Stock Index |
Global Stocks |
3.52 |
57.10 |
-4.02 |
4.40 |
1.33 |
|
DJ Real Estate Tot Ret |
Real Estate |
9.48 |
104.86 |
-11.82 |
2.45 |
10.29 |
|
Barclays 1-5 yr Gov/Cr |
Bonds |
1.19 |
5.31 |
5.54 |
4.91 |
4.94 |
|
CPI * |
Inflation |
0.30 |
1.83 |
1.79 |
2.30 |
2.38 |
Chart Data Source: Thomson Financial * CPI information is not current for past month. Market indexes are included in this report only as context reflecting general market results during the period. Marin Financial accounts may trade in securities that are not represented by such market indexes and may have long concentrations in a number of securities and in asset classes not included in such indexes. Accordingly, no representations are made that the performance or volatility of the Marin Financial accounts will track or reflect any particular index. Market index performance calculations are gross of management fees.


