What’s Been Happening?
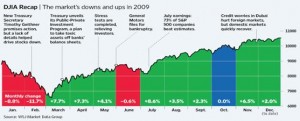
The US stock market as represented by the Dow Jones Industrial Average continued its remarkable recovery. The index gained 8.1% during the last quarter of 2009 and finished the year up 22.7%. Much as we enjoy rising markets, a pullback or two following 8 out of 10 positive months would be healthy. However, as the outlook improves for recession-depressed corporate profits, gains in stock prices should not be unexpected.

Source: Wall Street Journal Market Data Group 12/30/09
Trends to be Aware of
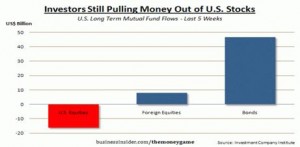
Despite the run up in stocks from March on, investors stuffed their money into bond funds in 2009. According to Investment Company Institute statistics released December 30th, nearly $350 billion of net new cash flowed into bond mutual funds. By our calculations, that figure represents approximately 96% of net flows into mutual funds for the year. Stock funds experienced a slight outflow. We wonder how much more stock indexes would have risen if there was a positive flow of money into stock funds in 2009. Should investors return to being net buyers of stock funds in 2010, the supply could help support the gains from the recent rally.
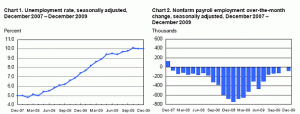
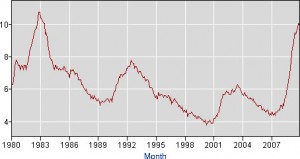
Unemployment continues to hover at the 10% level. While twice as high as seen at the end of 2007, the monthly changes chart to the right overleaf shows an encouraging trend of lower job losses. No doubt, it will take months of positive changes in employment to chip away at the unemployment rate. While hard to imagine now, once the economy begins growing, unemployment tends to step down from its highs at a similar rate to its ascension [see government chart of the Unemployment Rate since 1980].

 Source: United States Department of Labor, Bureau of Labor Statistics
Some Numbers for Comparison: The following table compares some key indices against which fund performance is measured. All figures are for the periods ending 12/31/2009.
|
Index |
What it Measures |
Last 3 Mos. |
Last 12 Months |
3 Years Annlzd |
5 Years Annlzd |
10 Years Annlzd |
| Standard & Poors 500 | U S Stocks w/div |
6.04% |
26.46% |
-5.63% |
0.41% |
-0.95% |
| Russell 2000 | Small Stocks |
3.87% |
27.17% |
-6.07% |
0.51% |
3.51% |
| MSCI EAFE | Foreign Stocks |
2.22% |
32.46% |
-5.57% |
4.02% |
1.58% |
| MSCI Emerging Mkts | Emerging Mkts |
8.58% |
79.02% |
5.42% |
15.88% |
10.11% |
| DJ World Stock Index | Global Stocks |
4.61% |
35.46% |
-4.19% |
3.50% |
1.19% |
| DJ Real Estate Tot Ret | Real Estate |
8.94% |
30.81% |
-13.75% |
-.95% |
9.73% |
| Barclays 1-5 yr Gov/Cr | Bonds |
0.43% |
4.62% |
5.67% |
4.52% |
4.96% |
| CPI * | Inflation |
0.17% |
2.90% |
2.34% |
2.60% |
2.54% |
Chart Data Source: Thomson Financial
* CPI information is not current for past month. Market indexes are included in this report only as context reflecting general market results during the period. Marin Financial accounts may trade in securities that are not represented by such market indexes and may have long concentrations in a number of securities and in asset classes not included in such indexes. Accordingly, no representations are made that the performance or volatility of the Marin Financial accounts will track or reflect any particular index. Market index performance calculations are gross of management fees.


