What’s Been Happening?
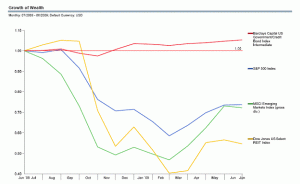
At the time of our last review safe Treasury bond investments were very popular. In the world of investments, oftentimes popular is not profitable. During the second quarter stocks as measured by the S&P 500 stock index jumped by nearly 16%. While that gain doesn’t erase all of the losses of the last twelve months, the chart below shows a portion of the losses have been recouped.
Some of the most risky sectors performed the best over the last quarter. Emerging market stocks were up roughly 35% while Real Estate Investment Trusts appreciated by approximately 29% during the quarter. Not many pundits were pounding the table for investors to increase exposure to either of those sectors three months ago. This confirms the wisdom of remaining diversified to capture the returns from the market when they occur given the difficulty to predict the timing. Long term US Government bonds fell by 1.6% during the quarter. We’ve talked about the flight to quality in the past, this quarter we witnessed a partial unwinding of the earlier panicked selling of stocks and riskier bonds for the safety of government bonds and CDs.

Source: Dimensional Fund Advisors Returns Program Second quarter 2009
Trends to be Aware of
We anticipate that stocks will continue to dig their way out of the trough over time but it will likely not be straight up form here. As you know, we have been expecting a pullback for some time and from June 12th to July 10th , we’ve seen a 7% correction in the S&P 500 index. We believe these pullbacks tend to be healthy for the market. However, our concern would be the potential for panic from some market participants if the correction is much more severe than a 10% decline. The shift from fear to greed happened so quickly in the last quarter that it seems plausible that sentiment could rapidly snap back to fear which could contribute to a larger pullback.
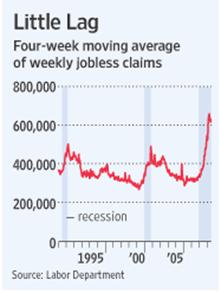
The unemployment rate typically peaks at the end of recessions. At 9.5% now, some economists estimate that we have reached or are approaching a peak. While it is likely too early to draw conclusions, new claims for unemployment benefits, illustrated by the chart on the left below, have begun to fall. Clearly, if this nascent trend continues it can only be positive for the economy and by extension the stock market.


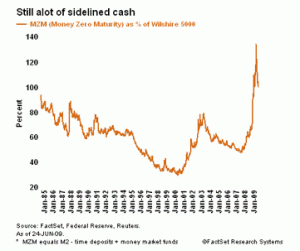
We draw comfort from the chart above right which shows cash on the sidelines. While cash reserves are off from a peak, they remain at relatively high levels. As short term interest rates remain near historic lows, investors will continue to look for more productive areas to place their cash. As signs become more apparent that the economy is stabilizing, equity markets may look more attractive to investors than money market accounts and CDs.
Some Numbers for Comparison:
The following table compares some key indices against which fund performance is measured. All figures are for the periods ending 06/30/2009.
|
Index |
What it Measures |
Last 3 Mos. |
Last 12 Months |
3 Years Annlzd |
5 Years Annlzd |
10 Years Annlzd |
| Standard & Poors 500 | U S Stocks w/div |
15.93% |
-26.22% |
-8.22% |
-2.25% |
-2.23% |
| Russell 2000 | Small Stocks |
20.69% |
-25.01% |
-9.89% |
-1.71% |
2.38% |
| MSCI EAFE | Foreign Stocks |
25.43% |
-31.35% |
-7.98% |
2.31% |
1.16% |
| MSCI Emerging Mkts | Emerging Mkts |
34.73% |
-28.07% |
2.95% |
14.72% |
8.70% |
| MSCI World Stock | Global Stocks |
21.05% |
-29.01% |
-7.48% |
0.57% |
-0.37% |
| DJ Real Estate Tot Ret | Real Estate |
29.28% |
-42.59% |
-19.17% |
-3.82% |
4.52% |
|
Barclays 1-5 yr Gov/Cr |
Bonds |
1.46% |
5.34% |
6.00% |
4.37% |
4.80% |
| CPI * | Inflation |
0.50% |
-2.30% |
1.76% |
2.42% |
2.55% |
Chart Data Source: Thomson Financial
* CPI information is not current for past month.

