The choppy seas of the worlds’ stock markets in the three months ending September 30th felt particularly rough coming as they did on the heels of  years of smooth sailing. US Markets fell over 7% after a long string of quarterly gains during a sustained rebound that began with the market lows of the GFC (Great Financial Crisis) of 2007-2009. For the first time since then we experienced a market correction, defined as a decline of 10% or more from a recent top.
International Developed Markets fared even worse for the quarter (-10.57%) but the Emerging Markets suffered the most, falling almost 18% in ninety days. The world markets tried to digest the news that China’s economy could not climb, “Jack And The Beanstalk” style, forever up without at least a pause along the way. Since the end of the calendar quarter there has been a significant reversal, but we’ll address that three months from now when we review the entire quarter.
Bonds, in the meantime, served their purpose as the sea anchor they are – reducing speed in the normal course of events but gaining 1-2% while the equity seas were roiled.
ABOUT TIME FOR SOME MARKET VOLATILITY
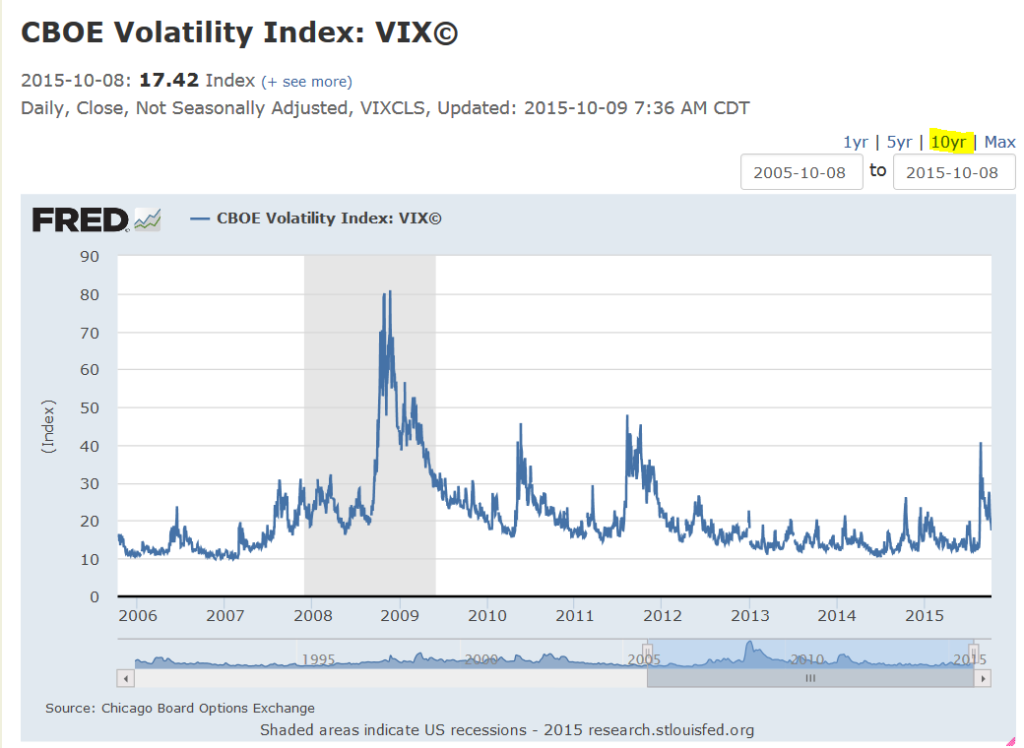
While we are not necessarily welcoming market volatility, we have learned to expect it. We believe, by definition, that averages of all sorts assert themselves over time. As you can see from the chart below, market participants have enjoyed three years of unusual calm in the stock markets since July 2012.
The recent  increase in market movements, while perhaps jarring to some, should be expected. This is the cost of returns in excess of bank account rates of 0.01% and the result from the day-by-day, second-by-second recalibration of prices for freely traded stocks. Think of volatility as the “price” of daily liquidity.
Although recent and significant, this bout of volatility is less in percentage terms than what we went through in 2011, and far less than six years ago. Diversified portfolios act as seaworthy crafts built to withstand the unexpected.
We’ve been getting very few calls about the recent swings in prices. We believe that is because our clients have been through this before and have confidence in our long term approach.
As always, we’d be happy to discuss this recent volatility or other matters with you at your convenience.
Chart source: Federal Reserve Bank of St. Louis – https://research.stlouisfed.org/fred2/series/VIXCLS

