
With the US stock market up over 10% through the third quarter this year, you may have asked yourself why your portfolio wasn’t up more. The answer lies in global diversification. You hold many types of investments in your portfolio and most of the other asset classes in the portfolio are flat or down for the year.
That’s a normal part of diversification. It’s rare to have all parts of the portfolio up or down at the same time. It’s normal to have some areas performing well while others aren’t.
Let’s look at the performance of global stock markets year-to-date through 9/30/2018 as an example:
US stocks (Russell 3000 Index) 10.6%
International stocks (MSCI World ex -USA Index) -1.5%
Emerging markets stocks (MSCI Emerging Markets Index) -7.7%
Looking at those numbers, you might wish you only held US stocks in your portfolio. But, as with so many things in investing, when you step back and look at a longer perspective, you more easily see the advantages of global diversification.
Let’s compare what your experience might have been like over the years if you invested just in large US Stocks (as represented by the S&P 500 Index of the largest US companies) versus having spread your stock exposure all over the US (including smaller companies and real estate companies) and also across developed international country stocks and emerging market stocks.
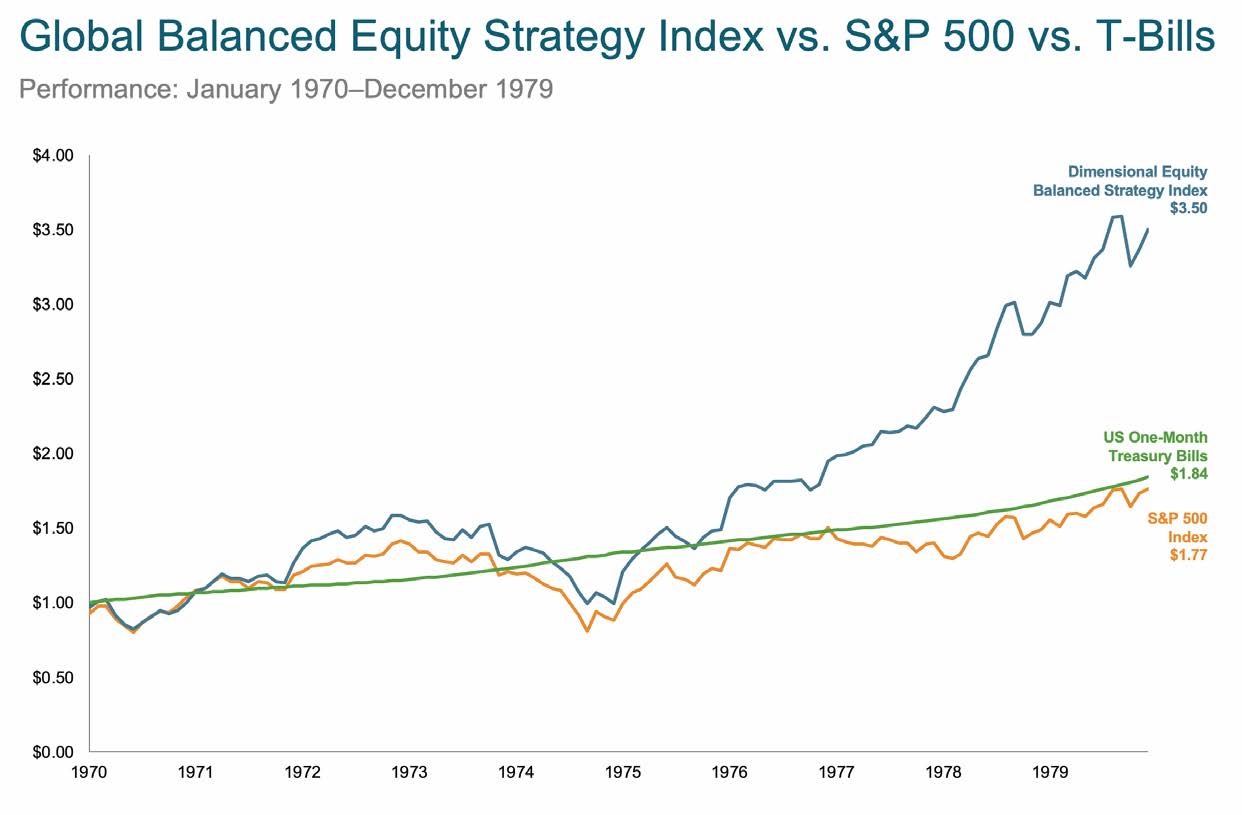
The following graphs show the growth of $1 over various decades invested in either just the S&P 500 (in orange) or diversified across global stocks (as represented by the Dimensional Equity Balanced Strategy Index – in blue)1
During the 1970’s, the globally diversified stock portfolio grew to about twice the amount of the US-only portfolio:
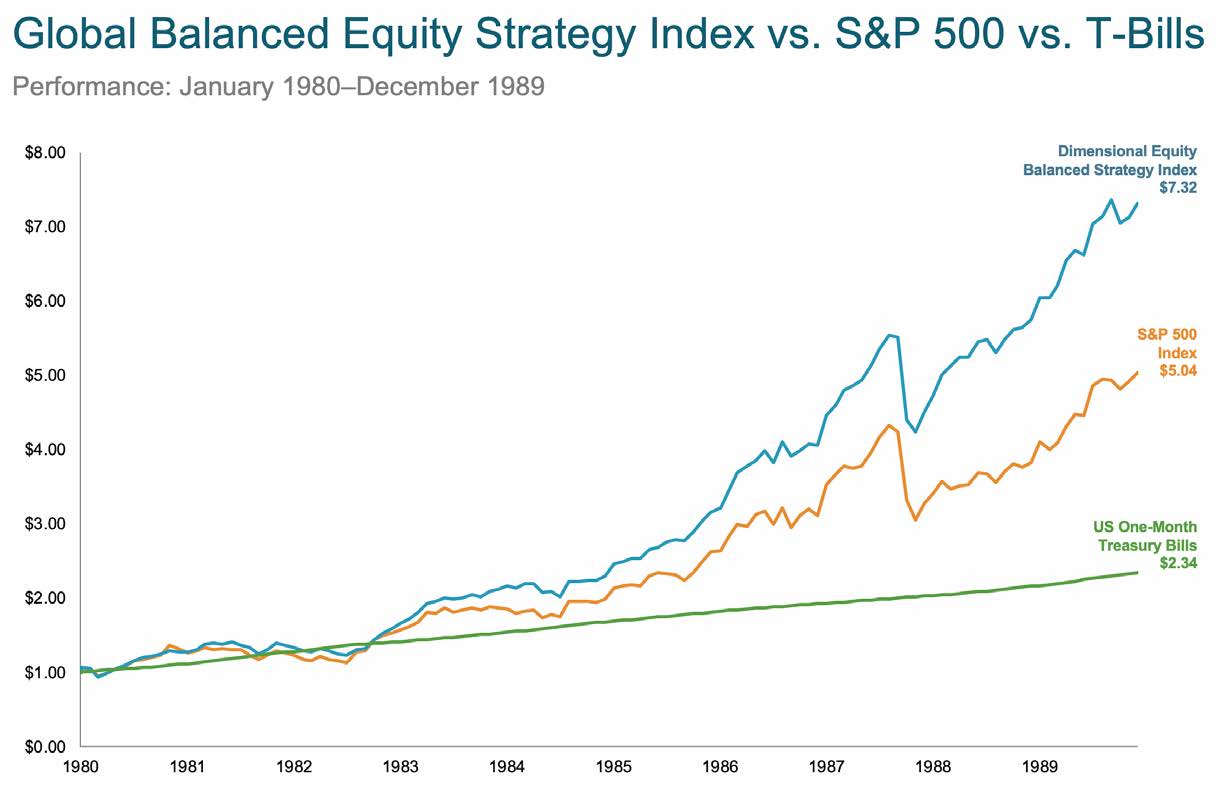
In the 1980’s the global portfolio grew to about 1.5 times the US portfolio:
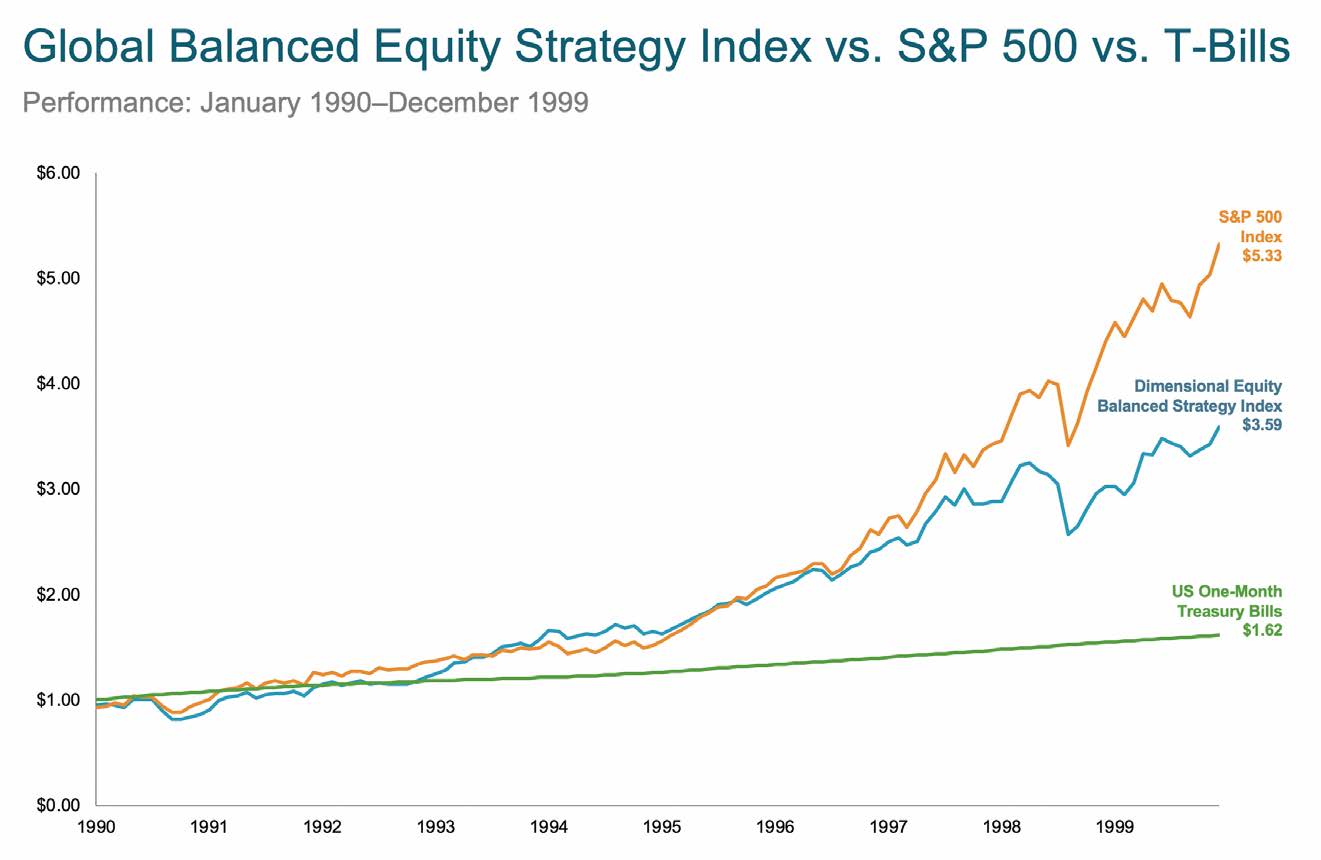
The 1990’s favored US stocks and the US-only portfolio grew to about 1.5 times the global portfolio:
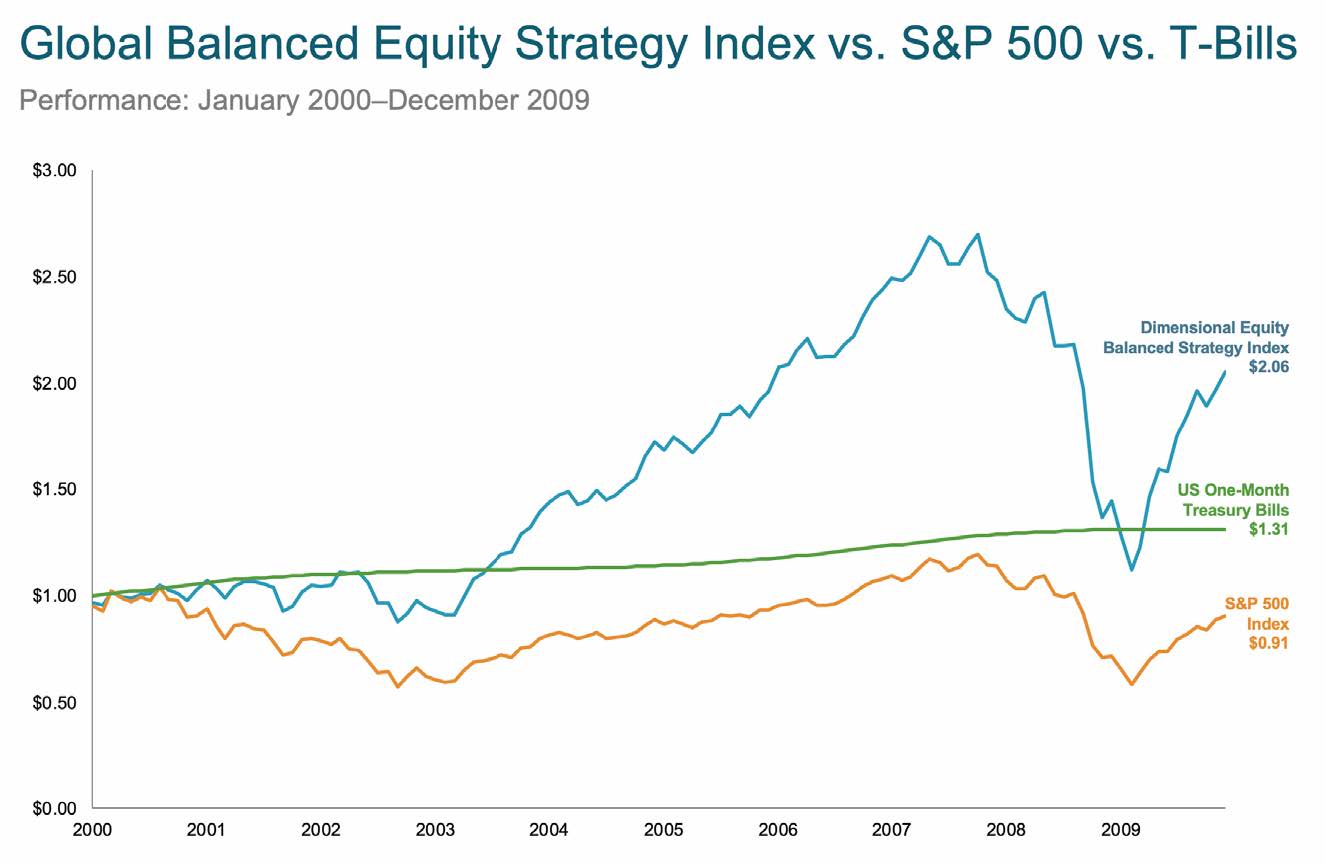
The 2000’s, often referred to as the “Lost Decade” when US stocks lost money, saw the global portfolio more than double:
In our current decade from 2010 through 2017, the US-only portfolio is ahead of the global portfolio by a bit over 10%:
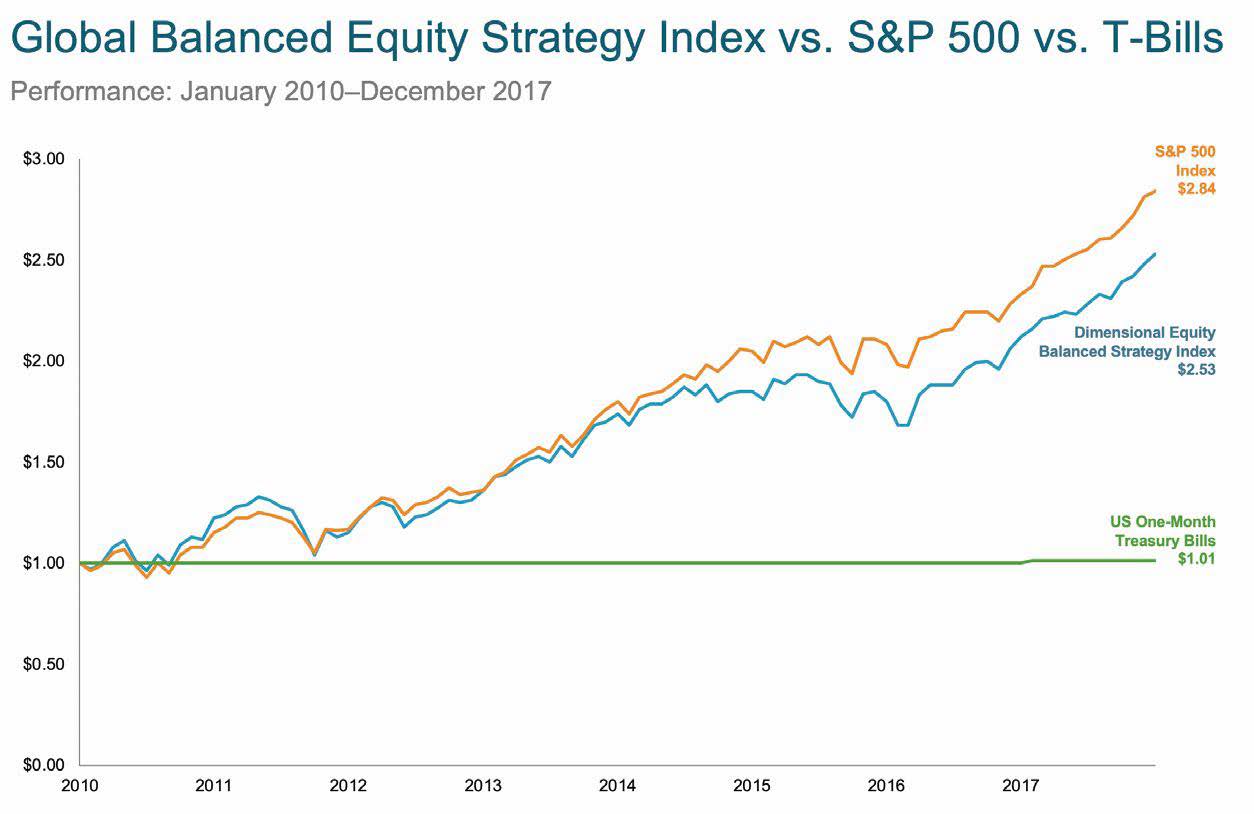
It would be tempting, depending on the decade you observe, to either favor US stocks or a globally diversified portfolio.
When you zoom out to look at the entire period from 1970 through 2017, you see the remarkable power of time and compounding. The globally diversified stock portfolio grew to almost 4 times the US-only stock portfolio:
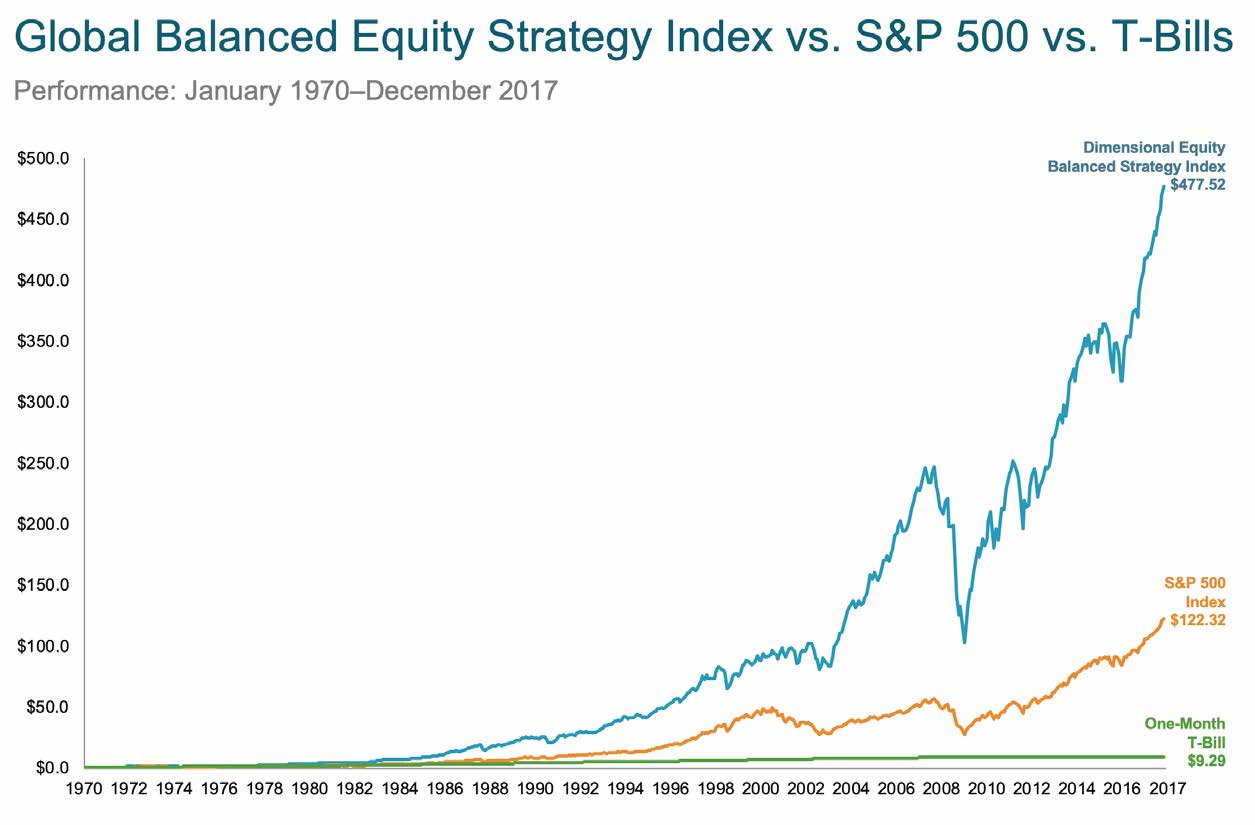
While part of this advantage results from the global portfolio including smaller stocks and real estate, a significant portion is attributable to the international and emerging markets stock exposure.
How often does the global portfolio outperform the US-only one? Since 1970, it has outperformed in about 82% of 10-year rolling periods and in about 87% of 1-year periods.
And the global portfolio has delivered higher returns: Over the last 44 years, the global strategy earned 13.5% annualized return while the S&P 500 earned 10.4% with a very similar level of risk.
What’s the moral of the story? The odds have historically been extremely in your favor that including global stocks (beyond just large US companies) would result in higher portfolio growth. We believe that that should continue to be the case.
When US stocks outperform international stocks as they are doing this year, we stick with the strategy. We wait patiently with conviction that global diversification pays off.
In our next monthly letter, we’ll discuss why we tilt portfolios towards smaller companies, cheaper companies and more highly profitable companies and patiently wait during times when those companies are less in favor. Stay tuned.
In the meantime, markets have been volatile in this new quarter, giving up some of their year-to-date gains. This kind of volatility is normal and expected. We’re happy to discuss this with you anytime. Please let us know if you like to get together to discuss this or anything else going on in your financial life.
————————————————————————————————————————————————————–
1 The Dimensional Equity Balanced Strategy Index is comprised of commercial and Dimensional indices, 70% US equity indices, and 30% non-US indices. US: S&P 500, large cap value, small cap, small cap value, Dow Jones REIT; non-US: international value, international small cap and small cap value, emerging markets, and emerging markets value and small cap. Rebalanced monthly.